Supramax spot sits near $19,000/day, but our model puts the peak in May and a softer, wider-banded back half — demand has done most of the work, with slow steaming on high bunkers tightening things further, and the Middle East making the path harder to call than usual.
The Supramax market has had a remarkable few months, but our forward model has rates easing from here: the 3-month forward sits at $15,579 and the 12-month at $13,389. The natural questions are what’s been driving the strength, and how much weight to put on the model’s softer forward path.
May looks like the peak month
Our preliminary April reads put Supramax cargo demand at around 103 Mt — one of the strongest Aprils on record. May data is still firming up and the headline will shift as more port calls are confirmed, but even allowing for revisions it points to a clear demand peak.
Three flows look to be doing the heavy lifting. Indonesian coal is the biggest, with SE Asia tracking near 14 Mt loaded (~+16% YoY); Indonesia → East Coast India and the round-trip back into South China are absorbing ships faster than they release. Atlantic agri is the second engine: ECSA and US Gulf both look up around 18% YoY as the harvest window opens, with Atlantic ballasters drained westward at the same time as the Pacific holds onto its ships. And Med + Black Sea loadings appear up around 22% — more cargo from more places at once.
What actually moves the rate
Our sensitivity analysis is unambiguous. Coal volumes account for roughly 46% of rate variance in our 2026 model, with ores and minerals adding another 20%. Iron ore and agriculture each chip in around 8–9%, and voyage-day assumptions — the slow-steaming lever — contribute a meaningful 7%.
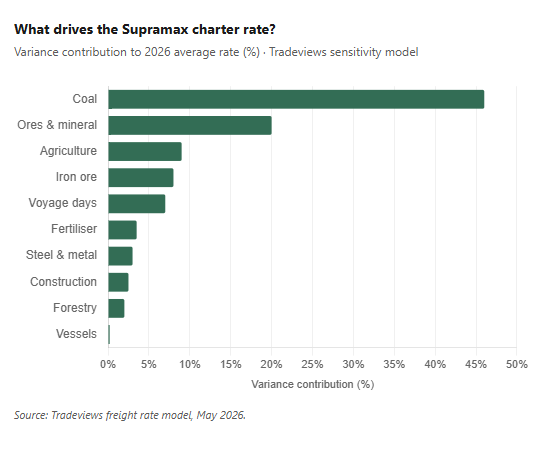
That’s why we keep coming back to Indonesian coal flows: it’s not just the biggest cargo by volume, it’s the single largest swing factor in where rates end up. When SE Asia coal turns, the rate environment turns with it.
Slow steaming on high bunkers
Bunker prices have stayed elevated through the spring on the back of Middle East tensions, and operators have responded by slow steaming to manage cost. Our voyage data shows average voyage days running about two days longer than normal in March, April, and May. With ~4,100 ships in the segment, that’s a few percent of working capacity removed from the market without a single vessel leaving service. Combine that with the cargo peak in May, and you have the conditions for the kind of move we’ve seen.
The forward picture
Off the April peak, our model has rates stepping back into the $16,000–$17,000 range through summer, drifting toward $12,000 by December as seasonal slack arrives. The trough sits at end-2026 / early-2027 around $10,500, before a partial recovery into a stable $13,000–$14,000 range across H2 2027.
Two things are worth flagging from the bands. The uncertainty is widest around May — the peak — and narrows considerably from June onwards as forward demand assumptions converge. And the most likely 2026 average comes out around $16,500–$17,000/day: well above where the curve sits across most of H2, but well below current spot. The model’s central case is that 2026 is a strong year, just not as strong as it looks today.
Where rates go from here
The Middle East situation is the obvious wildcard, with bunkers as the lever to freight: if tensions escalate, slow steaming intensifies and effective supply tightens further; if they ease, vessels speed up and the supply cushion goes. Either path could matter more than the cargo flows themselves. So while our base case is firm rates into June and a steady easing across H2, calling it with much confidence isn’t realistic — there’s two-way risk, and we’d rather flag it.
We encourage our customers to do their own modelling using our tools. Do you have questions, pushback, or a different view? We’d genuinely like to hear it — drop us a line.