Is the term ‘volatility’ code for “I Don’t Have a Clue”? When an analyst uses the word ‘volatility’ during a shipping presentation, I can’t help but fear they aren’t actually sure what the future may look like. Despite this hesitation surrounding the word, I found myself using ‘volatile’ to conclude our last market outlook blog for 2021.
Changes in the shipping market demand are often event-driven. Most cargoes move up and down on a cyclical basis but fundamental changes happen normally due to political or economic changes. Covid-19 has increased the complexity of the market. Therefore, reading the market is much more difficult now. As an analyst should we just be honest about this or do we just say, “there will be increased volatility”?
In this article we are only focusing on cargo volatility, not freight rate volatility. One should translate into the other. However, freight rates are renowned for being ‘spikier’ when fleet utilisation increases. This is a study for another day.
The evidence
I set out looking at the different cargo series for post-covid and pre-covid. Initially, I was expecting higher fluctuations post pandemic. Sadly, this wasn’t the case. I focused mainly on dry cargo as the tanker market is very much controlled by OPEC decisions. Naturally, the dry cargo market is open to a host of influences. This can make it hard to predict.
You would expect instant changes after the pandemic arrival in March 2020. This can be clearly seen in nearly every commodity type. However, what is noticeable is that cargoes either have an increase in demand or decrease in demand without the volatility. As hard as I tried, volatility was increasingly more difficult to find.
I took 2019 as a base year, looking at the high points and the low points from the median. Layering this year on top of 2020 and 2021 data, it was easy to see if there were any fluctuations.
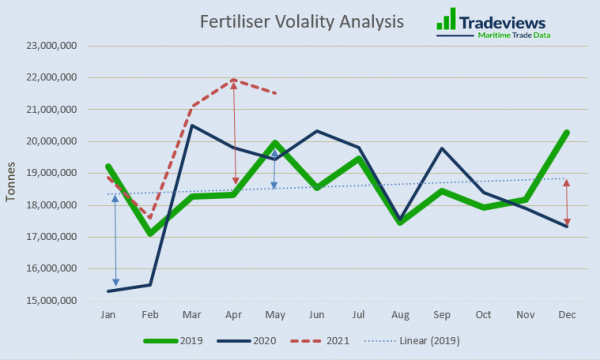
This example of fertiliser shows the range of movement before covid-19 was about 5 million tonnes. After covid-19 in March 2020, you really only see fluctuation no greater than 3 million tonnes. In 2021, there is another 4 million per month shift, from approximately 18 million to 22 million tonnes. To represent this mathematically, the standard deviation is actually the same at about 1.5 million tonnes indicating that Covid-19 has made no real difference.
What we can see from most commodities is a general increase or decrease in volumes as we enter the pandemic. For example, coal trade fell after Covid-19 and has retained the lower volumes. Iron ore, construction and agriculture have all done better with statistically less volatility. They have all been consistently strong which in turn has supported freight rates and have led to the strongest market we’ve seen for 10 years.
One of the push-pull factors we have spoken about a lot in our blogs is commodity prices. This factor has changed the behaviour of trade. Commodity prices were building over the last year, so trade increased. This is likely to be the main factor for less volatility.
Soya bean
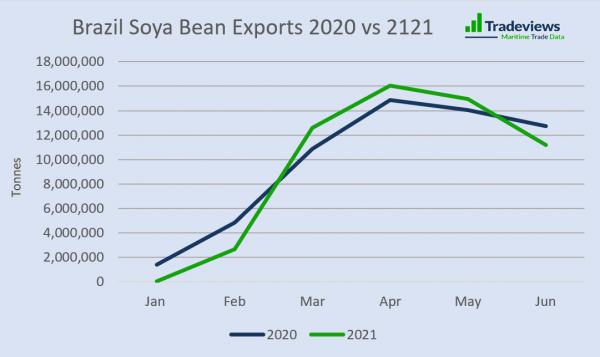
A small change we noticed is with grain trades. The continued high demand has meant that when the grain is available, it is exported quicker. If we look at the example of soya bean below, we see roughly the same volume moved in 2020 as in 2021. However, during the height of the season, the peak is a little bit higher. In the off season, the volumes are lower as stocks are depleted quicker. Again, this trend is likely a result of higher commodity prices and trader behaviour.
How else can we describe an uncertain market?
I know what you’re thinking, but you can take “Black Swan” straight off the list. This phrase is an excuse for not spotting a trend or event.
We definitely need to move towards more statistical terms like trends, cycles, seasonality, irregularities and event-driven shifts. Sometimes, it’s better to be honest and admit we can’t predict all the events and irregularities, even if we are able to anticipate trends, seasonality and cycles. It’s up to us to educate investors about the known and unknown factors. If volatility really is code for “I Don’t Have a Clue”, it’s important to communicate why.
What clues do we look out for in reading the future market?
Let’s not pretend that predicting the future is going to be easy, particularly partway through a pandemic. There are three main factors that we need to weigh up in our view of the future.
1. Commodity Supply and Demand
As well as a publicised shortage of microchips which is affecting manufacturing production for many industries, demand is strong for most commodity groups. A lot of this is down to covid-19 but also a shift in global outlook with an acceleration of the green revolution. How long will this continue and what are the driving forces?
2. Withdrawing of Economic Stimulus
Similar to the global financial crisis of 2018, stimulus was poured into economies in order to prevent an economic crash. When these stimuluses are pulled back, then naturally we can expect a deceleration in economic activity. How and when this happens will depend on each country.
3. Covid-19 Response
There is definitely a divide between the ‘jabs’ and the ‘jab-nots’. Countries like India and Brazil have faced crippling waves from Covid-19 variants. While some countries that have achieved high vaccinations are now testing if they can open up and resume back to normal.
Conclusion
On the whole we have shown that volatility in demand has decreased during Covid-19 while now we look to the future to see how things will respond. This has been a bumper year for dry cargo. The big question is ‘will this continue into the medium term or will economic and industry factors cool demand in the future?’.
Trying to offer a position on the future is not for the faint hearted. It’s understandable why analysts use volatility as code for “I Don’t Have a Clue”. Breaking down the individual components of what we face is surely the right path for better understanding of the shipping market.