

Black Swan or White Swan?
Since its entrance on world stage, Coronavirus has torn up the script. Although heralded as a black swan event (Nassim Taleb in the Black swan published in 2007), there were many that did see it, like the WHO (World Health Organisation), The World Economic Forum and Bill Gates. Was their prediction enough to even mitigate it? Humanity has faced a `forgotten about event`, made more potent by its interconnectedness. However, the modern-day prophets proved inadequate in the current case. Covid-19 caught everyone and the maritime industry off guard, so how is it possible to forecast trade in a pandemic?
Tradeviews has traditionally not forecasted the cargo markets. We provide the tools that enable you to do this. However, when Russell Thompson, Managing Director, was invited to speak at a Bimco webinar in April 2020, he took it more seriously. In the first article in this series, we will review his forecasting approach. In the second article we will look to 2021.
Key Tools
What makes forecasting the outcome of such events difficult is complexity. You can only really form a view, a clear one, if you understand all the elements. The key in order to figure out all of the intricacies of the plot, is detail and accuracy. Detail makes the difference, as they say. Αn investment in such a multidimensional sector, like shipping industry, requires both of them.
Tradeviews data helps decipher of all the appropriate elements and understanding how they interact. These tools can help you navigate a more unambiguous view in difficult and unstable times. They also help teach how to forecast trade in a pandemic. Let’s take a look at what Russell presented in 2020.
Colour by Numbers
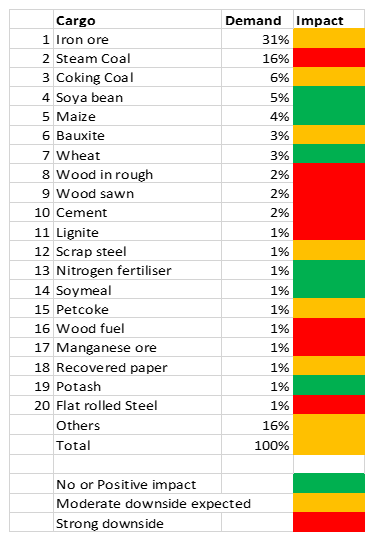
Here is the chart he drew up looking how the global dry bulk trade performed. Based on the cargo ‘demand’ column, he was able to assess the impactful parts likely outcome. Fortunately, he managed to call a high percentage of them right, which eventually corresponded to reality.
Let’s compare the above chart with this waterfall chart of actual commodity demand changes.
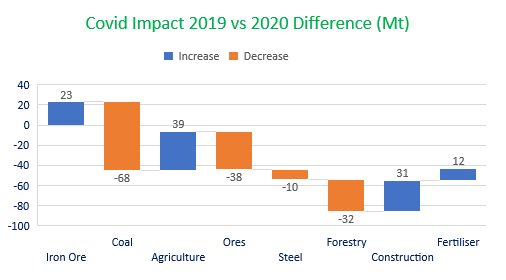
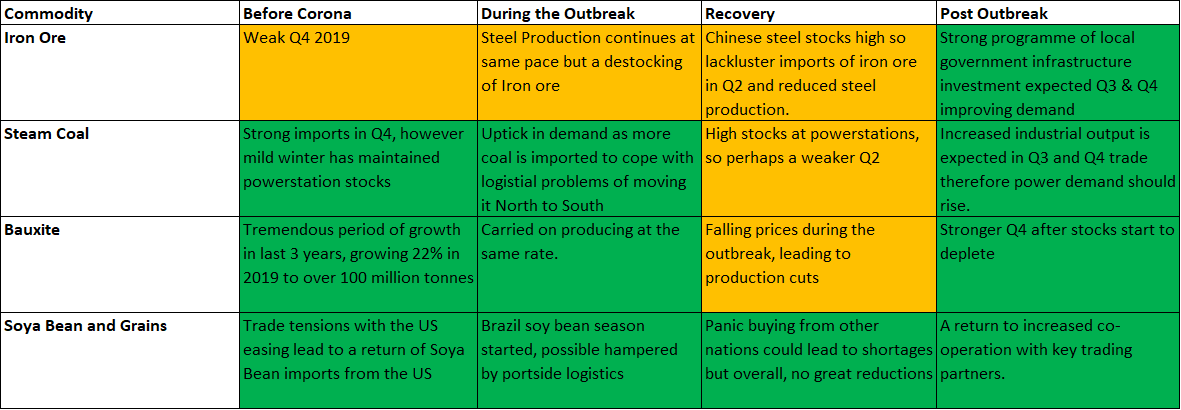
Iron ore trade experienced a slight increase during an overall turbulent year. The increase in demand was boosted by Beijing’s pre-pandemic issuing of special bonds, for infrastructure projects. Russell’s biggest regret about the forecast was not colouring iron ore green. To him the signs were there for a positive growth but he was swayed by market sentiment. A lesson for all of us.
Steel trade however faced exactly the opposite movement, a slight decrease, which is integrated in the general context of a recession due to the pandemic. A correct prediction.
Not surprisingly, coal trade experienced the largest reduction of all, of the order of 68 million tonnes. Again, Covid contributed significantly, however there was the evolving story of the deterioration of relations between China and Australia.
The same negative path followed ores and forestry commodities, in a more modest way.
On the contrary, agriculture and fertilizer commodities trade, as correctly predicted, remained resilient, with an increase of 39 and 12 million tonnes, respectively. South America’s agricultural exports mainly achieved to balance the market and especially after US trade agreement with China in 2020, that brought some noteworthy mutual concessions. This agreement was an important relief, in particular for soya bean trade.
The exception to the rule, we could say that was the construction sector. There was strong demand in volume, however these were for very short sea trades for gravel and cement. While the trade technically grew by 10% in volume, it only grew 4% in terms of tonne miles. The largest “investor” in the construction business was the US, which overturned the forecasts. Perhaps someone had a wall to build?
China’s impact
It is not the first time that China had the leading role. Its activity intensely influences the global picture. China managed to find its balance after the outbreak of the pandemic and even strengthen its global trade position. Consequently, it is responsible for the total balance of the market. China represented 33% of Seaborne Demand in 2020.
Iron ore demand remained strong as it is the world’s major steel producer. Soya bean trade also picked up due to US exporters returning to China. What’s impressive is this country has succeeded to remain dominant in the maritime trade for decades. One of its biggest advantages is that it always finds alternatives to thread its way through the market fluctuations and use them to its advantage.
The Chart below was also produced in April 2020 last year, highlighting the Pivotal role China could play and the importance to understand what it’s doing.
What for 2021?
A review of the past is a necessary guide to better deal with the future. And this time the future looks confusing. Τhe prevailing view is that a new commodity supercycle is about to emerge, driven by China. This is based on the soaring demand due to infrastructure investment, increased industrial output and stock management in China. As mentioned, it is the country that moves the whole global market.
Is the commodity supercycle a huge ‘bubble’ ready to burst or a more permanent situation?
Undoubtedly, the reaction of each cargo group varies. And here again lies the complexity of each maritime vessel type. There are many players in this game driven by demand and supply. Long-term effects of the pandemic are proved hard to predict. It requires analysis step by step.
In our next blog post will unpick what we expect for 2021 and continuing how to forecast trade in a pandemic. We hope you enjoyed our look back and we hope in some way it will help you look forward in what looks like an intriguing Year.
By Georgia Anastasiou