

It’s fair to say that the dry bulk market has caught everybody by surprise in quarter one. For the last 10 years, quarter one freight rates have always been a disappointment with the advent of Chinese New Year and seasonal lows for different cargo groups. So what is the dry cargo freight rates mystery?
In 2021 things were different. While most people were expecting rates to fall at the end of January, they maintained strength. The Baltic Index started the year at approximately 1583 and finished at the end of March at 2083. With an apparent 25% rise, you’d expect that there would be stronger cargo volumes travelling in dry bulk vessels. However, the data is not reflecting this. Dry Cargo Tonne mile demand went down. Many analysts are trying to find the cause behind this disconnect. We’ve heard many theories, but nobody seems to be sure.
The Data
When we look at time charter rates, we can see that the driver isn’t the Capesize market (the usual suspect). Instead, we had Handysize, Supramax and to a certain extent Panamax leading the charge at the end of February into March. During this period Capesize vessels were holding a good level but not to the same extent as the other vessel types.
With the Baltic Dry Index growing 25% in quarter one, we would expect to see robust dry cargo Tonne Mile demand growth during this period. Strangely we find there has been no growth at all compared to Q4.
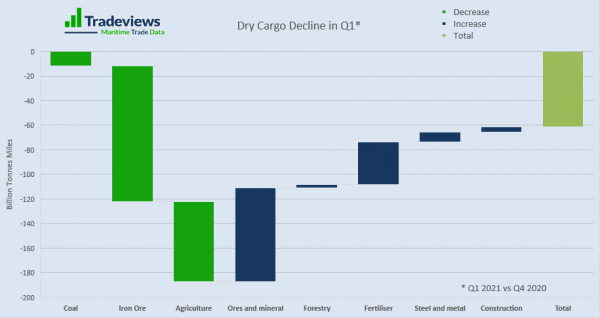
When we look at cargo volumes, we see that iron ore had a 4% decline and coal a 1% decline. The real shining lights were the ores and minerals, fertilizer and steel. These were the back bones of the smaller vessel types. It explains why these vessel types were doing so well. In particular bauxite was doing well. China was importing more volumes from Guinea and Brazil bolstering Tonne Miles.
The Mystery
Like Scooby & The Gang, “we’ve got a mystery to solve”. When iron ore and coal volumes fell, why did capesize TC rates maintain their strength? Overall, the end of the quarter one had declining cargo volumes. So why did we have stronger freight rates?
The ‘stand out’ unusual event for us is the increase in commodity prices, indicating something is happening across most commodity groups? The bounce back from covid-19 has stimulated global economies around the world. The construction sector is particularly hot. Demand is clearly abundant but supply is struggling to respond.
Noticeably global steel demand is on the rise. Chinese mills are increasing their steel output, even more so with strong steel prices for international volumes. Plus, there is additional fear of possible restricted iron ore volumes in the future from Australia; as the trade war rumbles on.
With the shipping cost at a lower percentage of the overall CIF cost, operational flexibility can be tolerated by traders. For example, longer queues at ports loading cargos. These and other relative inefficiencies contribute to support the freight rates.
In a perfect world, we’d like to see a strong correlation between cargo Tonne Mile demand and supply. In reality, there are many other forces at play which include sentiment, scheduling, weather patterns and operational constraints.
Conclusion
Some shipping analysts have been saying Q1 strength is down to increase demand. Others have been questioning why the volume data emerging doesn’t support this. In reality Q1 was slightly weaker than Q4 last year but it’s still much stronger than any other Q1 that we’ve seen in the last decade. For those who analyse trade, we try to present the story of what’s actually gone on and how that differs from initial perceptions. Armed with this information we can better understand the true drivers of the current market which better informs our understanding of dry cargo freight rates mystery.
In the first few weeks of May, capesize freight rates are back to levels not seen in some years. This is still showing us demand is pent up and the actual volumes moving may not be as high as we might think. With commodity prices still at record levels, the imbalance won’t correct itself overnight. If this is the case, then these are good signs of a very strong year to come for bulker vessels.