
The forward view: bulkers & tankers
The forward call
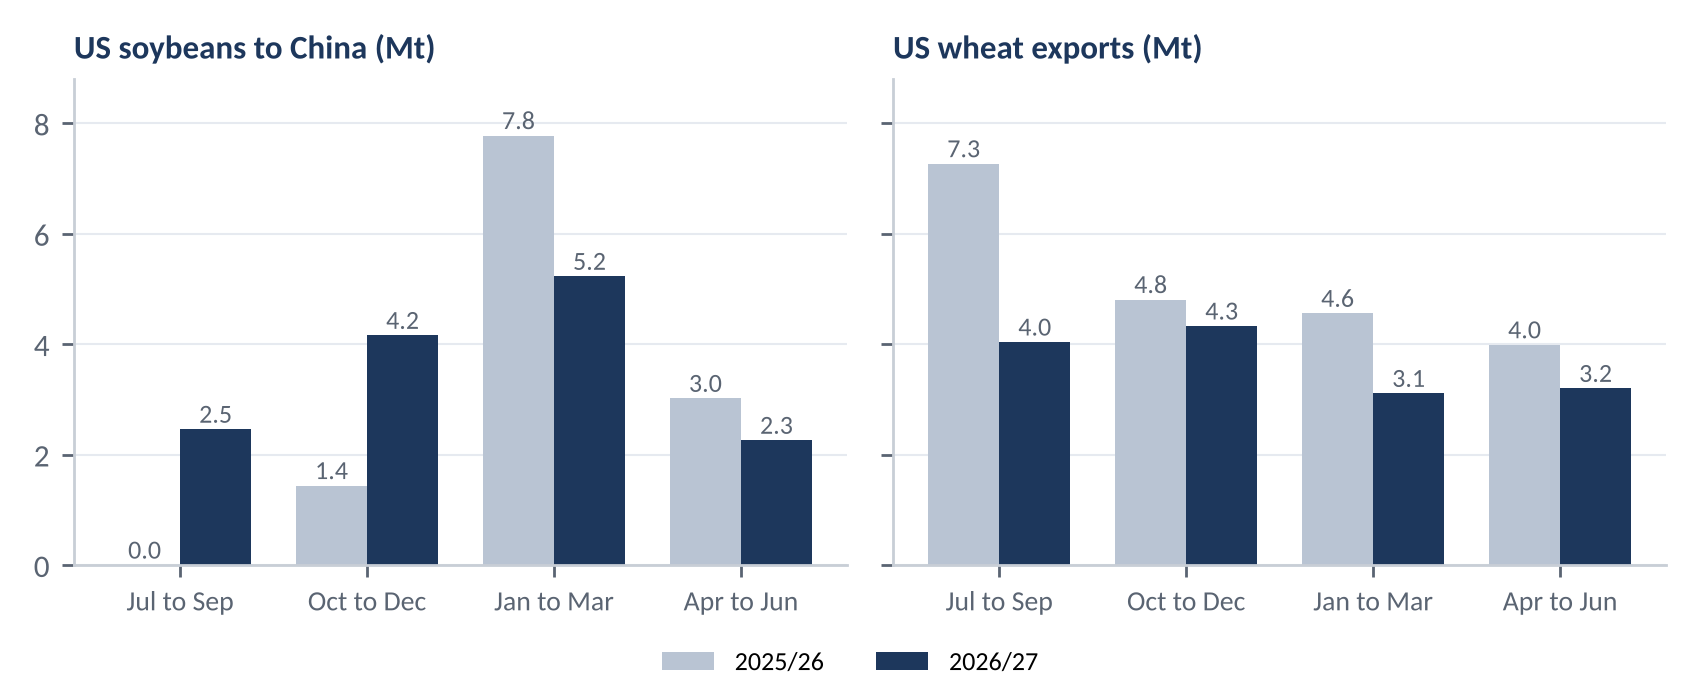
China took about 4.3 Mt of US soybeans in September and October, against almost none a year earlier during the trade war. Our view is that US soybean shipments to China look to be heading about 15% higher over the July to June 2026/27 season, with more of the buying at harvest time and less in the spring.
US wheat moves the other way. Exports in July to October were about 39% lower than a year earlier, and we expect them to be about 30% lower over the season. That reflects drought in the US Plains rather than tariffs. For ships, it means more US Panamax cargoes going to China this winter and less Supramax demand from the US Gulf over the season.
US soybeans to China, back at harvest
Last season, China bought almost no US new-crop soybeans until the Busan truce in late October 2025, then bought heavily from December to March. This season the buying has returned to its usual timing. US bean shipments to China were about 2.1 Mt in September and 2.2 Mt in October, and we expect around 4.2 Mt in October to December, almost three times last year.
The tariff gap remains. China kept a 10% retaliatory tariff on US beans, so they pay about 13% duty against 3% for Brazilian beans, and the truce now runs to 10 January 2027. From January we expect US shipments to China to be below last season’s post-truce catch-up, at around 5.2 Mt in January to March against 7.8 Mt. Over the season, we expect about 14 Mt, still well below the 25 Mt a year the US says China agreed to buy.
US wheat exports fall
US wheat exports in July to October were about 5.5 Mt, against 9.0 Mt a year earlier. This is not a tariff story, as China takes very little US wheat. Drought across the Southern Plains cut the hard red winter crop, and in August the USDA put US wheat production about 26% lower and exports nearly 15% lower this season. High fertiliser costs added to the pressure. Weekly US wheat shipments in late October were the lowest since records began in 1983.
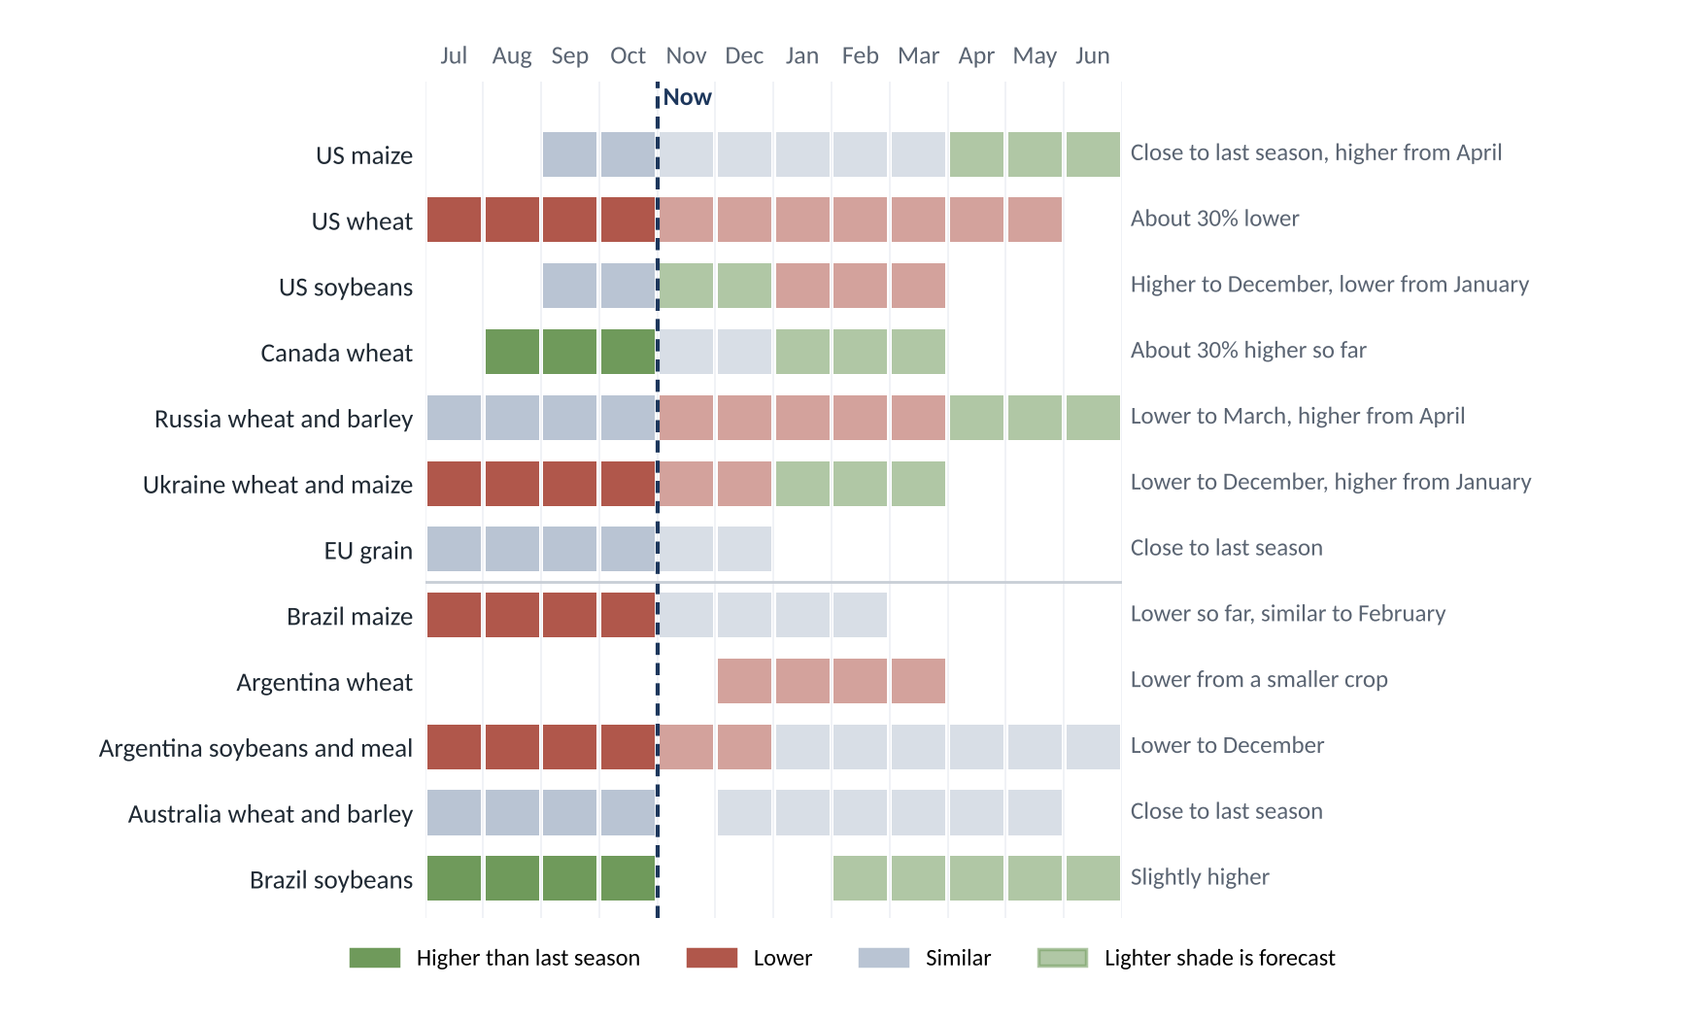
It is part of a wider squeeze. The USDA expects wheat production among the seven largest exporters to fall by about 11% this season, with Canada, Australia, Argentina and the EU all lower, while Russian and Ukrainian supplies face shipping disruption. We expect US wheat exports to stay below last season through to May, and to be about 30% lower over the season. Total US grain exports look to be about 6% lower, with maize close to last season through the winter and about 13% higher from April to June.
The rest of the season
Elsewhere, Brazilian soybean exports look to show a small rise, with the new crop loading from February. Brazilian maize exports were almost 30% lower in July to October, and we expect November to February to be close to last season. Argentine soybean and meal exports look about 28% lower over the season, and Canadian grain exports about 11% higher.
The war in Ukraine continues to weigh on Black Sea trade. Ukraine reportedly exported 1.26 Mt of grains and pulses in October, down nearly 50% on a year earlier, with wheat making up 954,000 t. We expect Ukrainian loadings to stay well below last season to December, before the maize harvest lifts them from January. Russia is having difficulty getting grain to alternative ports, and we expect Russian grain loadings in January to March to be around 40% below last season, then recovering from April.
What it means for ships
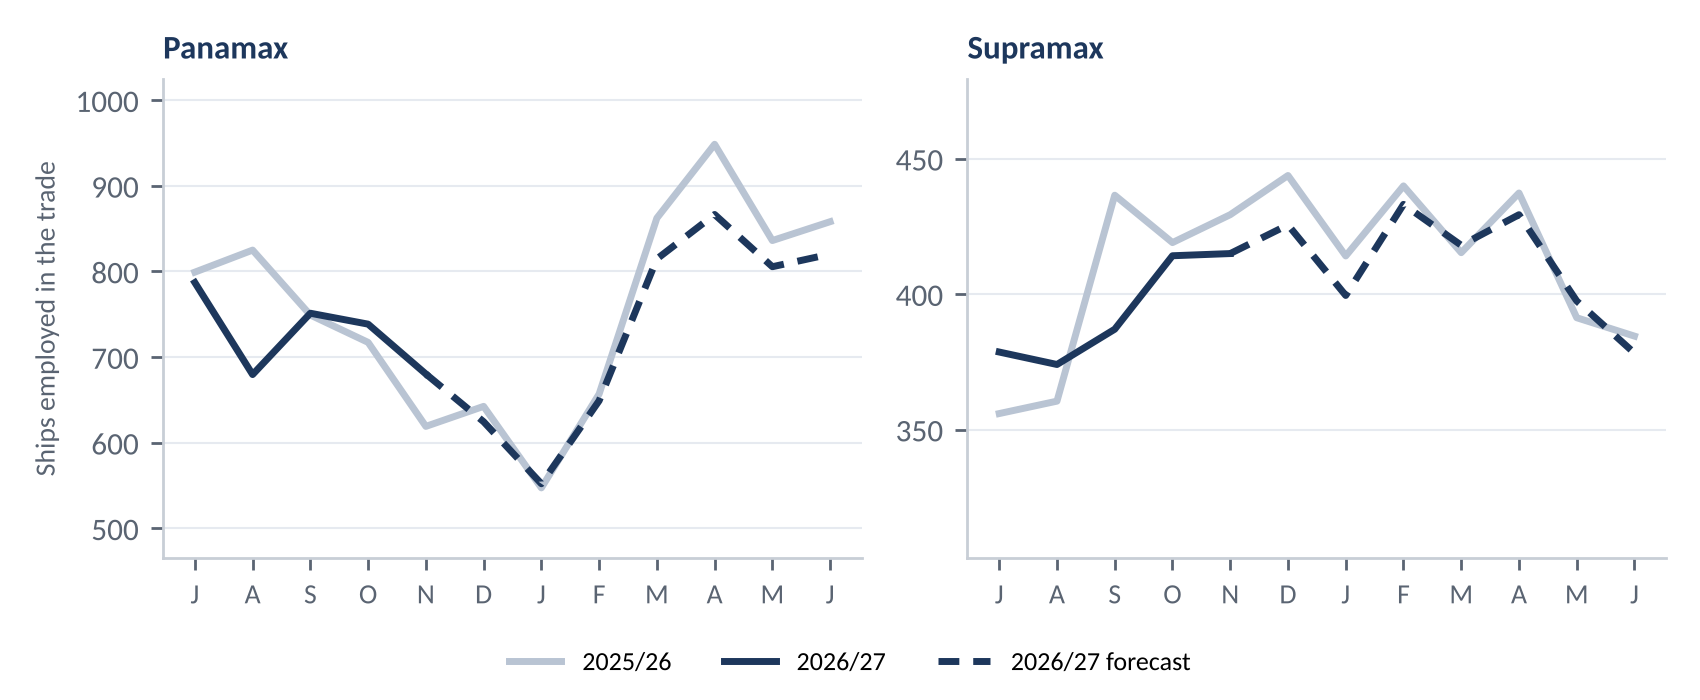
We measure ship demand in agribulk tonne-days, which count the ballast leg as well as the laden voyage, so long hauls such as the US Gulf to China count for more than short ones.
For Panamaxes, the change is mainly in where US cargoes go rather than how many there are. US Panamax agricultural exports in October to December look to be about 5% higher than a year earlier, as soybean cargoes to China roughly double while shipments to other buyers ease. From January, with less catch-up buying from China, US Panamax agricultural exports look to be about 7% lower than last season. Lower wheat exports weigh more on Supramaxes, and we expect US Gulf Supramax demand to be about 12% lower over the season.
Across all grain trades, we expect agribulk tonne-days to be about 3% lower for Panamaxes and about 1.5% lower for Supramaxes over the season. Lower Argentine soybean, Brazilian maize and US wheat exports, and fewer Russian cargoes before April, more than offset more Brazilian soybeans.
Where positioning may matter
- US Gulf, November and December. More soybean cargoes to China than a year earlier, with maize close to last season.
- US Gulf, January to March. Fewer soybean cargoes to China than last season’s post-truce surge.
- East Coast South America, March to June. More Brazilian soybean cargoes than last season, but fewer from Argentina.
- Black Sea, from April. Our forecast has Russian loadings recovering after a weak January to March.
Risks and our view
On the upside, China could buy more US soybeans to move closer to its pledge, and an easing of the war would let Russian and Ukrainian grain move more freely. On the downside, the US and China truce could lapse in January, which would hit US soybean cargoes from the US Gulf and Pacific Northwest. In Brazil, a stronger El Niño could hit the soybean crop that loads from February.
- The most uncertain call is US soybeans after January. Our forecast assumes China keeps buying at a lower rate than last spring. A renewed tariff dispute could cut that further, while a wider deal could lift it towards the pledged level.
Our view. China’s return to US soybeans at harvest moves more US Panamax cargoes to China this winter, while drought-hit US wheat exports weigh on Supramaxes. The January truce deadline is the point to watch.
Behind the analysis
The same country export data and forecasting framework are available to your team, on your own commodities and routes.
Book a demoData note
Data from Tradeviews research. Volumes cover grain, soybeans and soybean meal from the US, Canada, Brazil, Argentina, Australia, Russia, Ukraine and the main EU exporters; shipments to China are by declared next port of call. Agribulk tonne-days cover Panamaxes and Supramaxes, including sugar, and count the ballast leg. Customs data run to August or September 2026 depending on the country; later months are Tradeviews estimates and may be revised; forecast from November 2026. Seasons run July to June. Ships employed assume average cargoes of 85,000 t for Panamaxes and 60,000 t for Supramaxes.
For information only; not investment advice.