
The fluctuation of both container and bulk freights rates have led many to assume there is a large volume of bulk cargo that can transition between the two carrier types. For many analysts it’s been a confusing time during Covid. Trying to understand market dynamics is tough. Many analysts ask if container volumes moving to bulkers is a factor at play.
We had a look at the United States as a case study. They record total vessels and container vessels separately in their customs data. The time frame we looked at was from January 2019 to August 2021. We can then compare pre covid and post covid changes in behaviour.
Container Freight Rates Soaring
The extremes in bulker freight rate levels since the pandemic have not been seen since the financial crisis. However, the extremes in container freight rate levels have never been seen. Therefore this three year period should tell us something about the impact of price movements. In 2021, dry cargo freight rates have on average doubled since pre covid levels where container freight rates are approximately five times higher.
To give you an example, container import premiums have increased between $8000 and $10,000 compared to pre pandemic levels of less that $2000. As exports are on the container backhaul leg, premiums are less affected. To show you the contrast, according to Drewry, Shanghai to LA is $11,173 and LA to shanghai is $1,320.
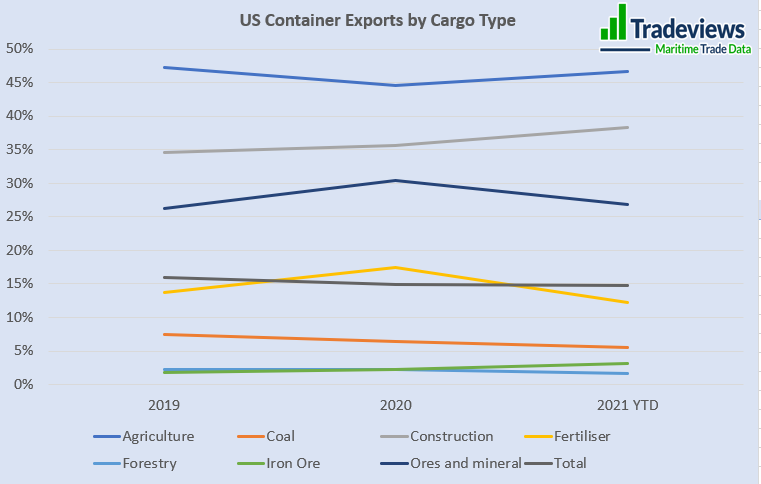
US Export Volumes in Containers
 Comparing the differences between pre-covid and post covid is relatively minor overall. In real terms there’s a 1.4% fall in containers which is just over 1.5 million tonnes. This is approximately 2 Supramax vessels per month additional benefit to bulkers. While this seems relatively minor on one hand, it is more significant if the pattern is replicated across the globe.
When we look at the individual cargo groups, we can see that the story varies. The cargoes that make the biggest difference by their volume is Forestry and Agriculture. While Forestry is now growing in 2021 despite a fall in 2020, agribulks in containers have been declining overall. The other interesting observation is a significant fall in the ‘ores and mineral’ group.
Petcoke’s greater use of bulk is significant in 2021. It looks like approximately 1.5 million tonnes will move out of containers back to bulkers this year. The swing is similar with copper concentrates, however the volumes are much lower with a handysize vessel per year gain for bulkers.
Overall , slightly more grains are moving into bulkers, however a significant fall away from this trend is Soyabean which is increasing in containers. Many of these changes might be for operational reasons.
US Imports in containers
Overall container volume percentage of bulk imports bulks have moved very little during the covid period. Volumes went from 10.7% in 2019 to 11.4% in 2020 back to 10.9% in 2021 YTD. Bucking the trend is construction volumes which has increased in 2021 by 3%. This was driven by cement and ‘home improvements’ demand. Notably, aluminium ingots moved the other way and far less were traveling in containers dropping from 55% in 2019 to 38% in 2021.
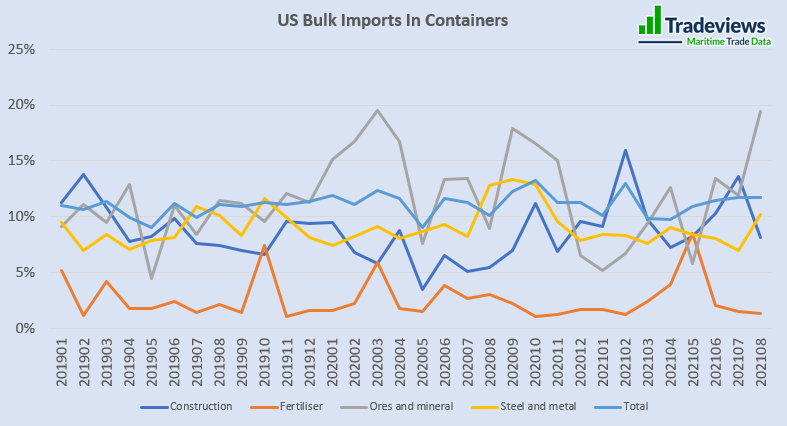
This chart shows the monthly variation of the significant import groups. You can see volatility across all groups but the ‘Ores and mineral’ seem more responsive to changes in prices but there is a high amount of volatility for each month.
Conclusions
Overall we can concluded that price fluctuations changes have had minor impact on US volume percentages of bulks in containers. Bulkers have benefited slightly more from exports and Import volumes, but export cargoes have made more of a difference to bulkers than imports.
The bulk cargo category that benefited the most is ‘ores and minerals’, especially those where larger volumes are transported. These include petcoke, copper concentrates, salts and various other ores. The economic and operational factors makes it easy to switch into bulkers. Grains carried in containers seem to have a low coloration to container prices. It’s likely the changes are more related to operational considerations, which can make containers an easier mode to use in some instances.
Consumer behaviour factors have provided an uplift in container volumes, particularly in forestry and cement. These are centred around the home improvements market. There’s a high volatility to the volumes moving month to month by containers but over a longer period it’s easier to pick out the larger shift in trends.
If you would like more detailed numbers, please do get in touch and we’d be happy to provide a deeper analysis.