
The Strategic Engine
Precision trade flows and vessel demand, powered by global cargo forecasting.
We go beyond historical reporting to provide forward-looking clarity. By aggregating global trade flows across seven specialized commodity modules, we transform millions of data points into a high-definition view of future demand.
Our proprietary software doesn’t just organise data—it builds a roadmap. With intuitive tools you can navigate the complexities of international trade and project market shifts before they happen.
Our Edge
Transport mode
Bulkers/tankers vessels, containers/coaster vessels, land-based
Area Segmentation
Maritime regions/ geopolitical zones/ inter-country coastlines
Distance Variables
Average miles, Tonne miles, Voyage days, Tonne days
Forecasts
5 year monthly forecasts for all dry bulk data by industry experts
Seasonality Analysis
Compare multi-year monthly data
Long History
Data from the year 2000.
For Strategists
Designed to support decisions
Connectivity
Integrate our data into Excel or internal system. AI ready
Explore Our Vessel Modules


Explore Our Industry Modules


Explore Our Reports


Tradeviews in numbers
Testimonials

We continue to find Tradeviews an excellent platform

Tradeviews helps to give us an accurate perspective of global trade

Reliable data and presented well. Very professional company with a fast response. Russell and his team are great to work with.
We’ve worked with Tradeviews for over 10 years and they provide excellent service and value.
Blog
Trump Tariffs – How Will It Affect Trade?
It feels like we’ve been here before in 2018. When, after the shock and awe announcement of 25% tariffs, the whole package was watered [...]
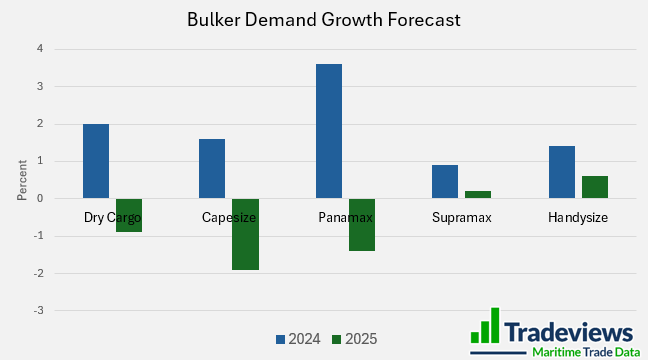
2025 Dry Cargo Outlook – Start Of The Year
Everybody is watching Trump's every words since he was elected president. While he's threatened to disrupt world trade with tariffs, we only change our forecasts [...]
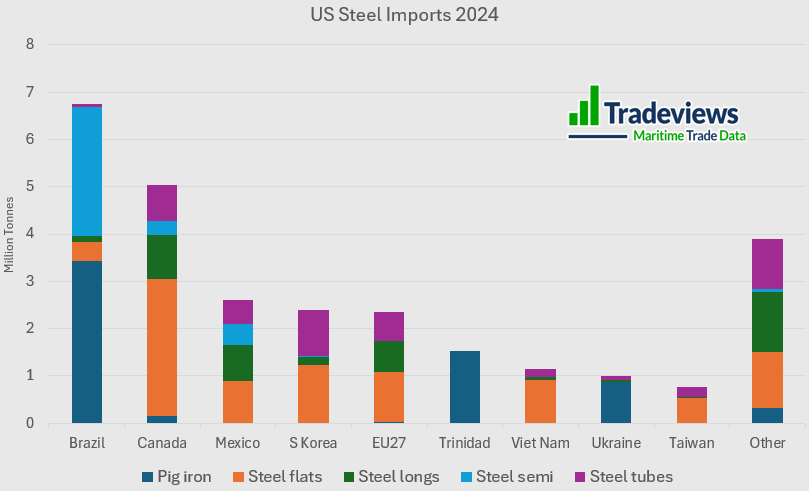
Steel Export Trade: 101 Guide
Steel export trade can often be in the news for the wrong reasons. Anti-dumping legislation, particularly in the US, gives the impression of a protectionist [...]

Does Steel Slump Signal Trouble: Dry Cargo Key Insights
China's leadership is making a concerted effort to bolster its manufacturing sector, particularly focusing on higher tech industries like batteries, EVs, and solar panels. [...]
Book Demonstration
See how the Trade Analytics Platform can help you. Get a 1-2-1 tailored and personalised demonstration.